YData Profiling: Streamlining Data Analysis
YData Profiling stands as a powerful tool designed to simplify and enhance the data exploration experience, catering specifically to the needs of statisticians and data scientists. With a focus on providing a one-line Exploratory Data Analysis (EDA) solution, YData Profiling delivers an extended analysis of your DataFrame, akin to the convenience offered by pandas’ df.describe() function. This analysis can be seamlessly exported in different formats such as HTML and JSON.
Quickstart:
Getting started with YData Profiling is straightforward. Begin by installing the library using either of the following commands:
%%capture
! pip install -U ydata-profiling ipywidgets scikit-learn
Key Features:
- Type Inference: Automatically detects columns’ data types, including Categorical, Numerical, Date, etc.
- Warnings: Summarizes potential data quality issues such as missing data, inaccuracies, skewness, etc.
- Univariate Analysis: Provides descriptive statistics and informative visualizations like distribution histograms.
- Multivariate Analysis: Includes correlations, detailed analysis of missing data, duplicate rows, and visual support for pairwise interactions.
- Time-Series Analysis: Offers statistical information relative to time-dependent data, along with auto-correlation and seasonality insights.
- Text and File Analysis: Includes text category detection and file/image analysis for comprehensive exploration.
- Comparing Datasets: Enables a fast and complete report on the comparison of datasets with a single line of code.
Example Code:
For a practical demonstration, consider the following example generating a standard report for a Pokémon dataset:
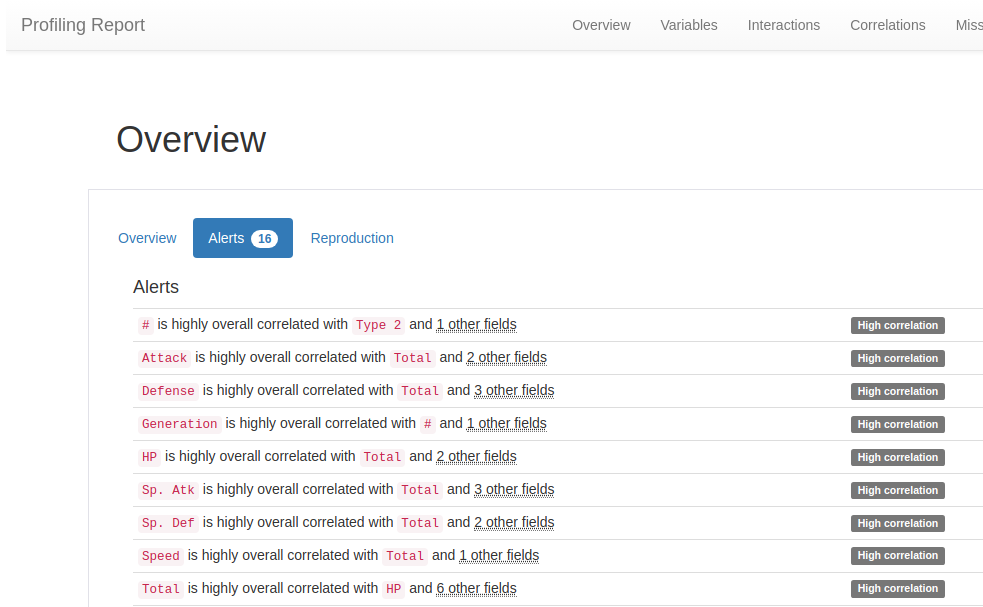
Generating a Standard Report
This cell contains a script to fetch a Pokemon dataset and display the default ProfileReport from ydata_profiling. The report includes some additional correlation calculations (see line 23 below). Line 34 profile_report.to_file("pokemon.html") saves the report to an HTML file which you can open in a new browser tab.
import numpy as np
import pandas as pd

from ydata_profiling import ProfileReport
from ydata_profiling.utils.cache import cache_file


file_name = cache_file(
    "pokemon.csv",
    "https://raw.githubusercontent.com/bryanpaget/html/main/pokemon.csv"
)

pokemon_df = pd.read_csv(file_name)

profile_report = ProfileReport(
    pokemon_df,
    sort=None,
    html={
        "style": {"full_width": True}
    },
    progress_bar=False,
    correlations={
        "auto": {"calculate": True},
        "pearson": {"calculate": False},
        "spearman": {"calculate": False},
        "kendall": {"calculate": False},
        "phi_k": {"calculate": True},
        "cramers": {"calculate": True},
    },
    explorative=True,
    title="Profiling Report"
)

profile_report.to_file("../output/pokemon.html")

profile_report
Comparing Datasets
We can also generate reports comparing two datasets. This example below compares training and test pokemon datasets. train_test_split from scikit-learn is used to create the train and test datasets.
import numpy as np
from sklearn.model_selection import train_test_split

from ydata_profiling import ProfileReport


file_name = cache_file(
    "pokemon.csv",
    "https://raw.githubusercontent.com/bryanpaget/html/main/pokemon.csv"
)

pokemon_df = pd.read_csv(file_name)

X = pokemon_df[['Total', 'HP', 'Attack', 'Defense', 'Sp. Atk', 'Sp. Def', 'Speed']]
y = pokemon_df[['Type 1', 'Type 2']]

X_train, X_test, y_train, y_test = train_test_split(
    X, y, test_size=0.33, random_state=42)

train_df = X_train
train_report = ProfileReport(train_df, title="Train")

test_df = X_test
test_report = ProfileReport(test_df, title="Test")

comparison_report = train_report.compare(test_report)
comparison_report.to_file("../output/comparison.html")

comparison_report
Time-Series Data Analysis:
For time-series datasets, YData Profiling introduces a specialized time-series mode, as illustrated in the analysis of Microsoft’s stock price:
import numpy as np
import pandas as pd
from ydata_profiling import ProfileReport
from ydata_profiling.utils.cache import cache_file

file_name = cache_file(
    "msft.csv",
    "https://raw.githubusercontent.com/bryanpaget/html/main/msft.csv"
)

msft_df = pd.read_csv(file_name)
msft_df["Date"] = pd.to_datetime(msft_df["Date"])

# Enable tsmode to True to automatically identify time-series variables
# Provide the column name that provides the chronological order of your time-series
profile = ProfileReport(msft_df, tsmode=True, sortby="Date", title="Time-Series EDA")

profile.to_file("../output/msft-report-timeseries.html")

profile
Explore the capabilities of YData Profiling and transform your data analysis workflow into a seamless and comprehensive experience, aligning with the familiarity of Excel, Power BI, and SAS.